CSCI 201: Intro to Programming (Java)
Lab 5: Drawing a bar chart
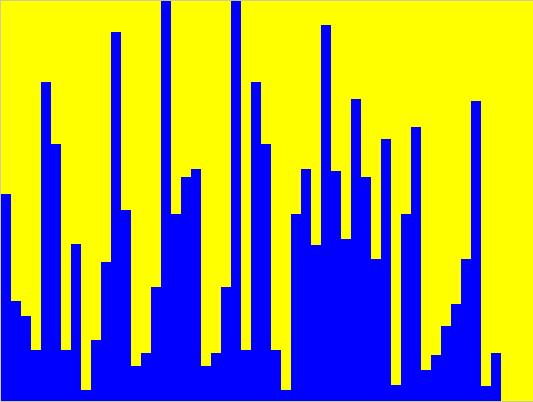
The purpose of the Lab is to design Java Swing application
Bar.java that
takes several non-negative floating point numbers as command-line
parameters and draws their
bar chart. Each blue bar in the diagram corresponds to a particular number and
its height is proportional to the number value. The maximum column height
should be normalized to the window height. Set the window size
400x300 pixels.
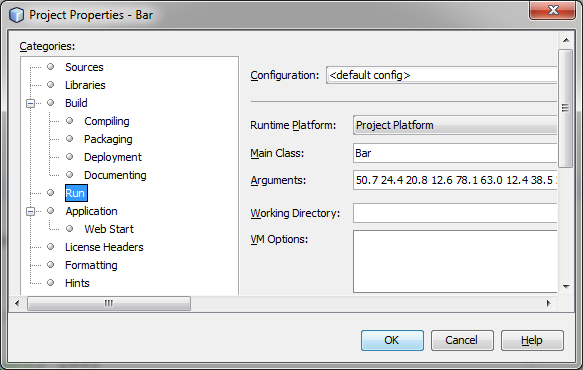
All the numbers should be separated from each other by one or several
spaces and passed to the application as follows. Open Run
-> Set Project Configuration -> Customize window and copy the
following into the Arguments field under Category
Run.
50.7 24.4 20.8 12.6 78.1 63.0 12.4 38.5 2.8 14.9
34.1 90.3 46.9 8.5 11.8 27.9 98.0 45.9 54.8 56.9 8.5 11.8 27.9 98.0 12.6 78.1
63.0 12.4 2.8 45.9 56.9 38.1 92.0 56.3 39.6 74.1 54.9 34.7 64.2 3.8 45.8 67.1
7.5 11.2 18.3 23.8 34.9 73.5 3.6 11.8
Make sure that every two consecutive numbers are separated by at least one
space.
Implementation hints
- In order to pass the command line parameters to the
paintComponent() method of class DrawPanel add to this class
public variable String[] data.
- Add to the SwingApp constructor the third parameter String[]
data and after instantiating the panel set its data variable as
panel.data = data. This way the call to the SwingApp constructor in your
main() method should look as follows: SwingApp(400, 300, args)
The paintComponent() method
- Allocate a local variable max of type double and initialize it
with 0. This variables will store the maximum number
and will be set up in the next step.
- Make a loop over all elements of array data and store the
maximum number in variable max.
For this, in each step of the loop, get a new number and compare it with
the current value of max. If the new number exceeds max, replace
max with the current number. Use the following template:
for (int i=0; i<data.length; i++)
{
  double num = ...; 			//parse data[i] as double
  if (num is larger that the current value of max)
    store the value of num in max
}
|
- Use the following code to get the panel dimensions:
int height = getHeight();
int width = getWidth();
|
- Compute the vertical scaling factor
|
double scale = height / max;
|
- Compute the width of each bar in your chart as
|
int barWidth = width / n;
|
- Set the desired foreground color (blue in the above example).
- Declare a variable x of type int containing the
x-coordinate of the left edge of the current bar. Initialize x with 0.
- Do a loop over all elements of array data. In each step of the
loop do the following: